Single Test Group
The Current (Conformance) page represents the latest Conformance metrics for the selected Conformance Suite and Test System.
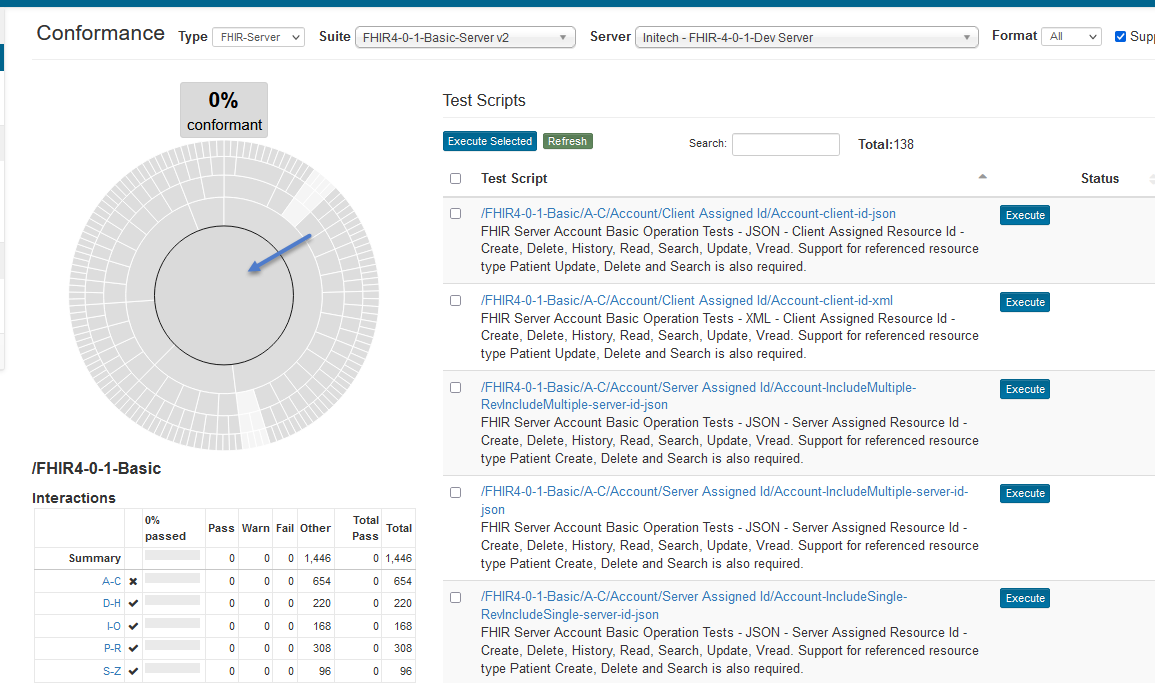
You can get to the Conformance page by clicking on the Conformance / Current link on the left menu. The Conformance Suite below contains a single test group. Initially, assuming no test executions, you should see all grey on the Results Summary chart:
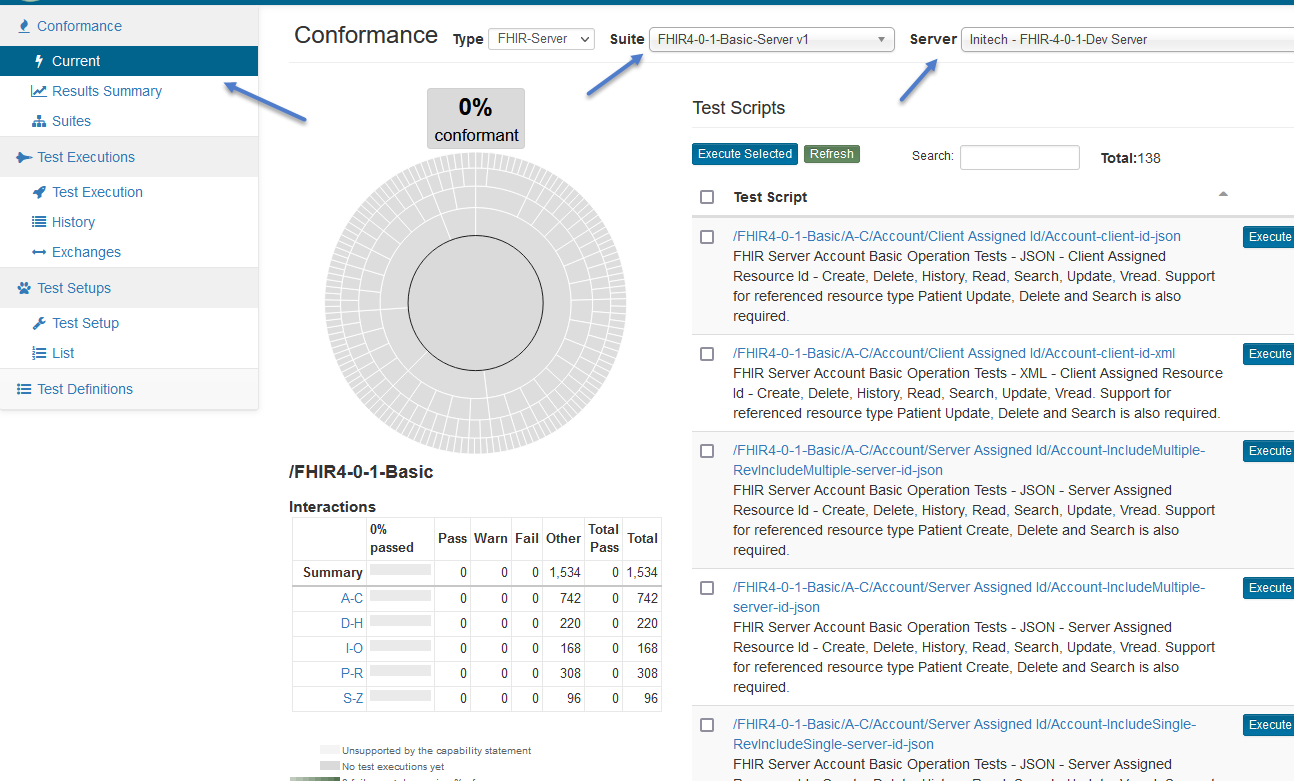
The dropdowns for Suite and Server are filtered to those that you have access to.
Note
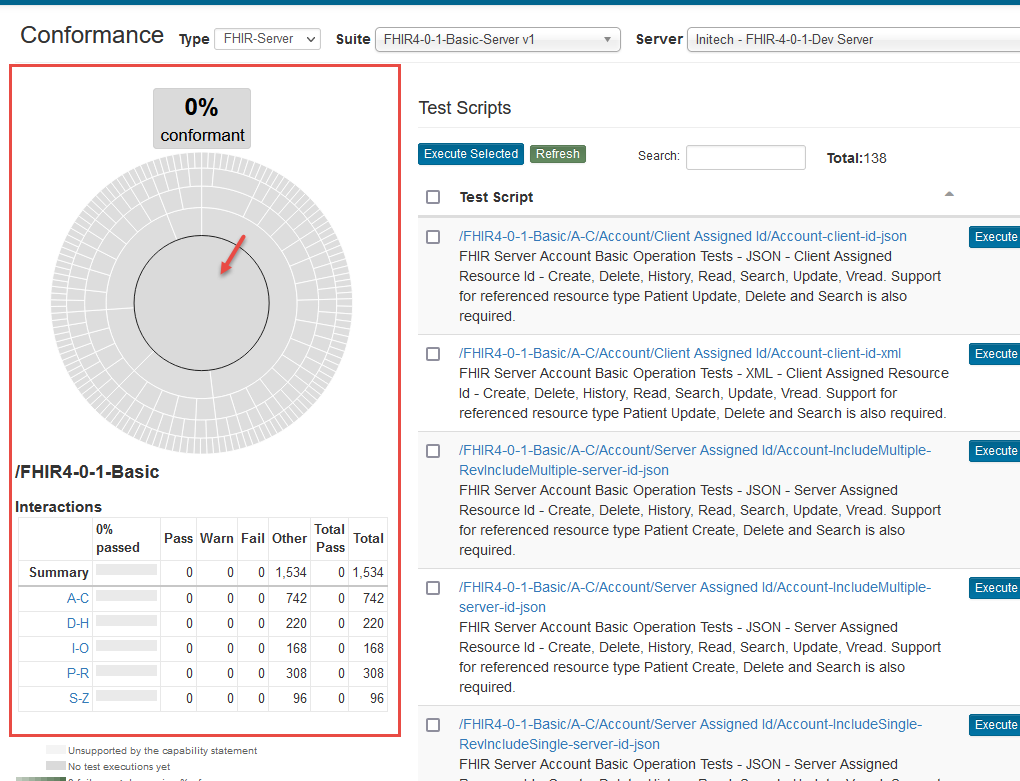
When a Conformance Suite contains a single test group, the test group chart and the Results Summary chart (red rectangle below) are the same.
The center-most band (red arrow) that’s selected by default is the root of the Results Summary chart (red rectangle below). That band represents the root of the /FHIR 4.0.1-Basic single Test Group that composes this Conformance Suite.
If you’d like to focus only on interactions that your capability statement supports, click on the Supported Only checkbox:
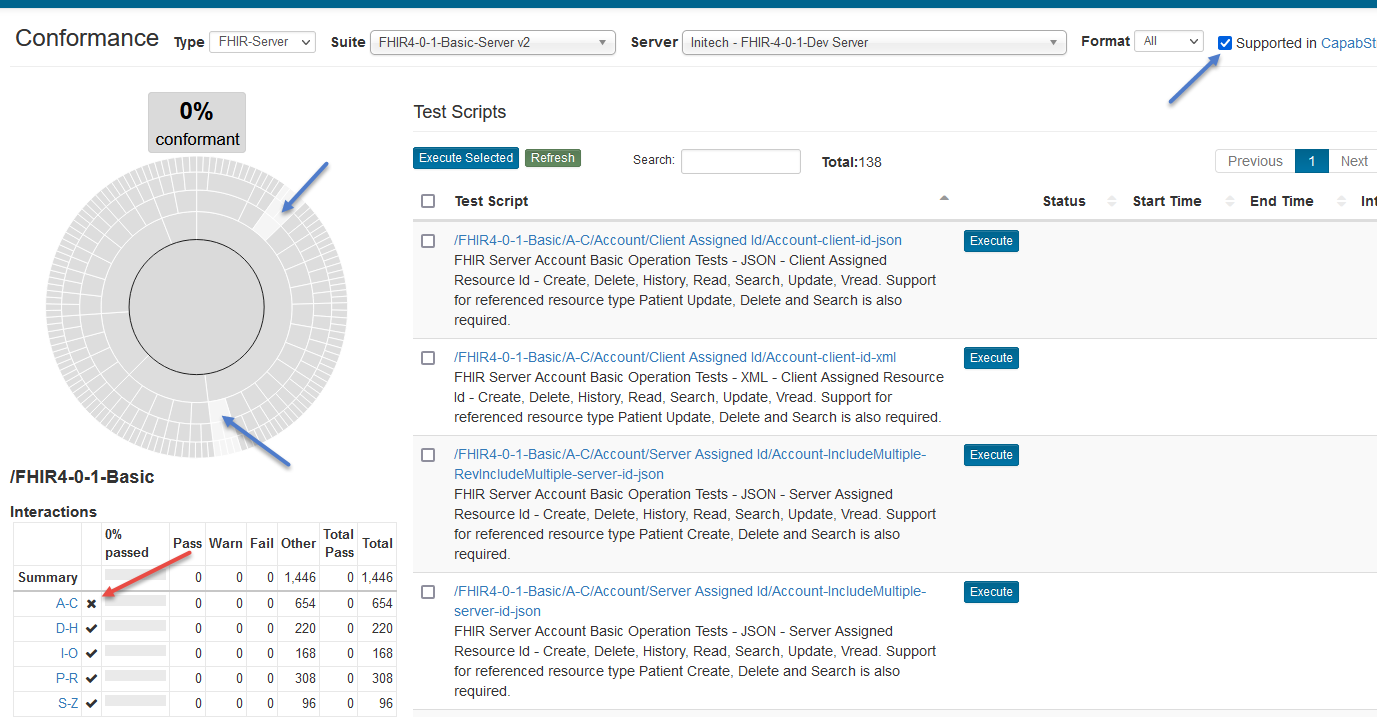
Notice that some bands have changed to silver (blue arrows above). Those are the areas that are not supported by this test system. Only the interactions that are supported by the Capabilities statement are contributing towards ‘% Conformance’.
Note that the Supported checkbox may not be available for all Conformance Suites. The Suite owner can choose to make the checkbox unavailable for a suite in which case all interactions will contribute towards ‘% Conformance’ regardless of support in Capability Statement.
Unsupported Interactions
Notice that the A-C group is not supported yet by the Capability Statement:
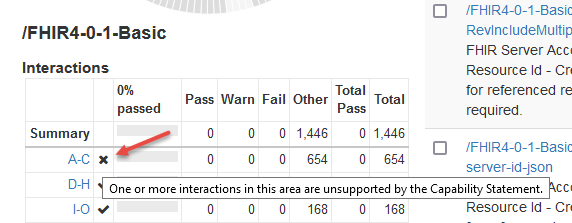
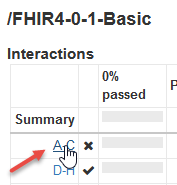
You can drill down by clicking on the A-C link within the table:
The Results Summary chart changes focus to a deeper level (blue arrow below). The unsupported groups have an X next to them (red arrow below):
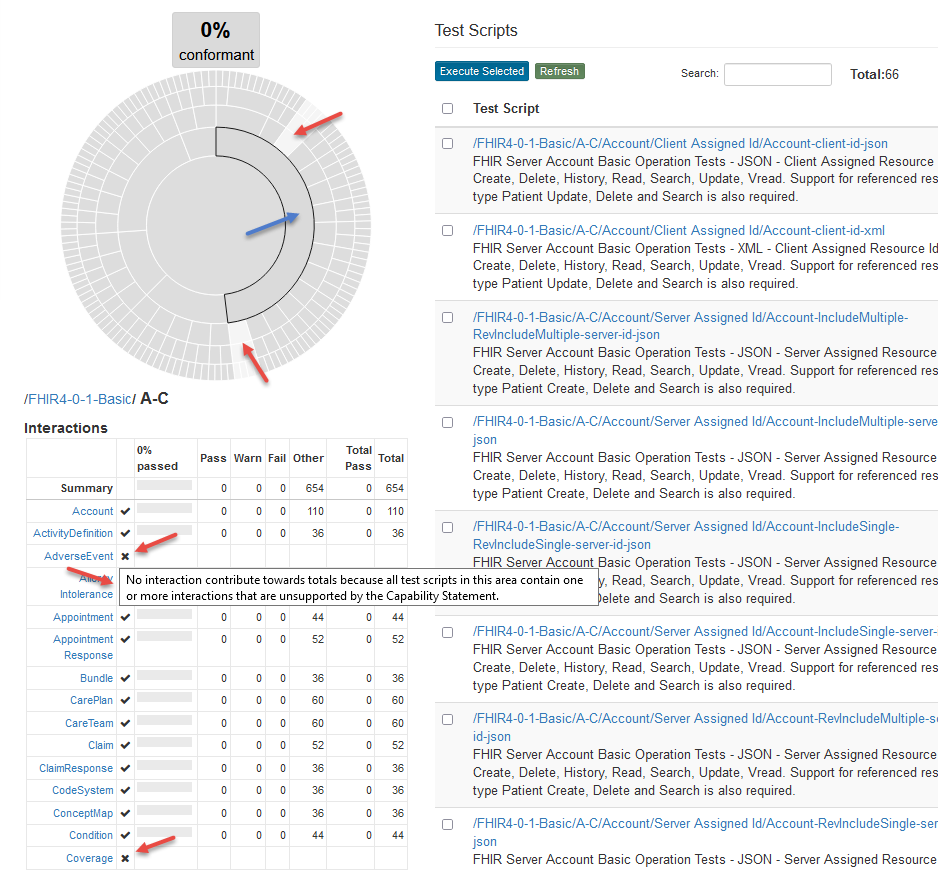
You can continue drilling down by clicking on the link within the table with an X until you get to the leaf node:
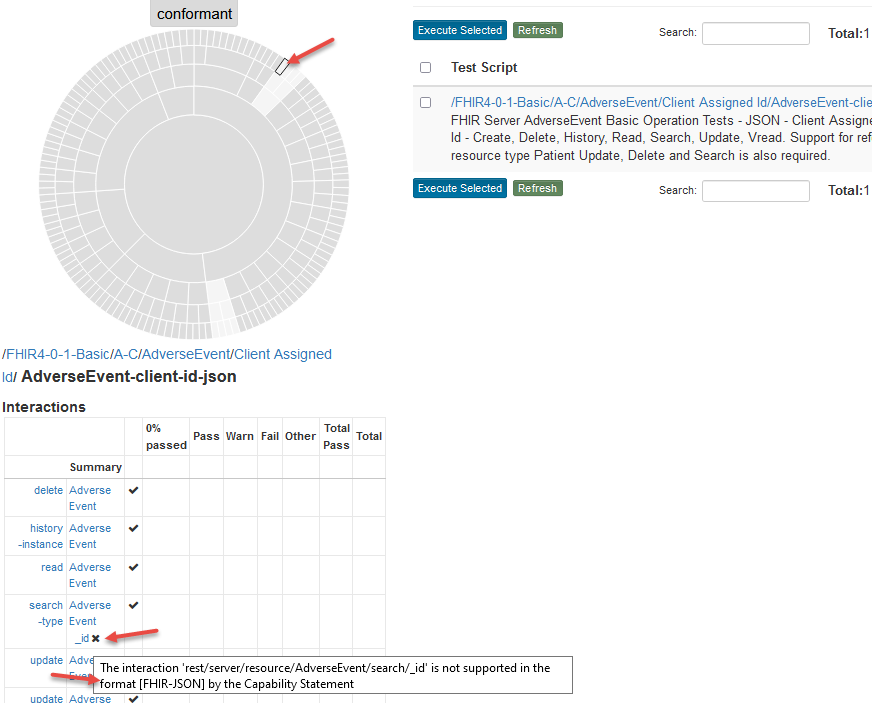
You can see the explanation (above) for why the test script along with its parent nodes were excluded from contributing towards the Results Summary ‘% Conformance’.
Click on the root node of the Results Summary chart so the center-most band is highlighted:
Suppose you’re interested in executing tests for the Patient resource. You can hover over the Results Summary chart to find the Patient resource:
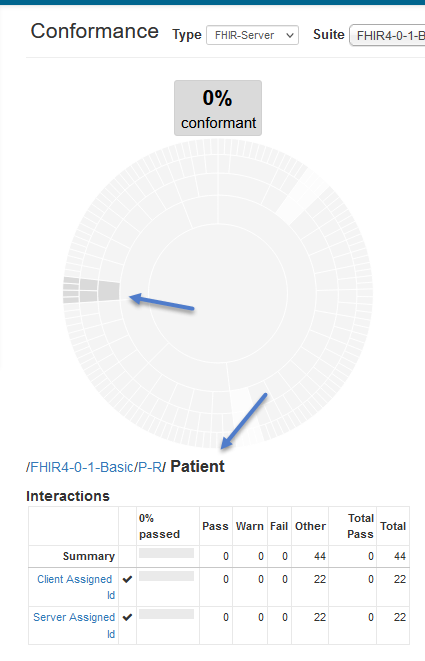
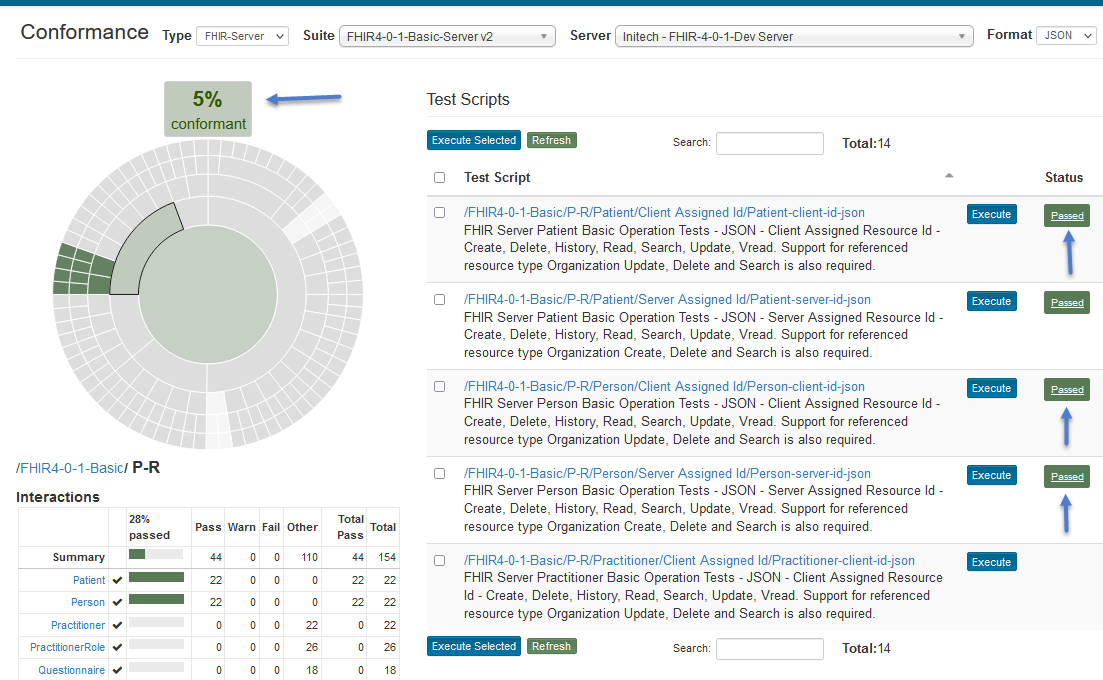
Click on the /FHIR4-0-1-Basic/P-R/Patient band (below arrow below) on the Results Summary chart:
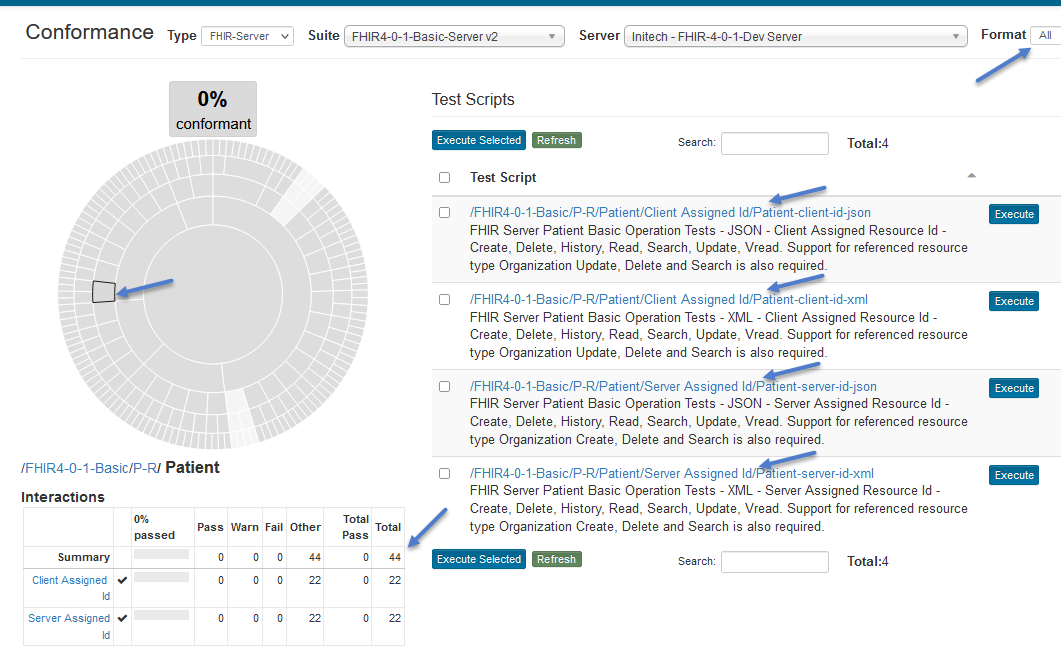
You can see there are 4 test scripts (on the right) with a total of 44 Patient interactions (below arrow above).
This particular suite offers filtering by formats (All, XML, JSON). Perhaps you’re interested in testing out the JSON format first. You can select JSON in the Formats dropdown:
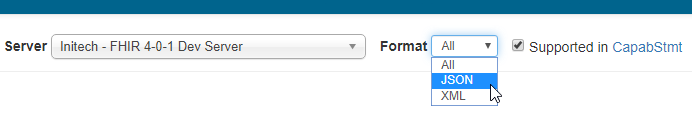
The test scripts and counts change to reflect the JSON interactions available in the suite:
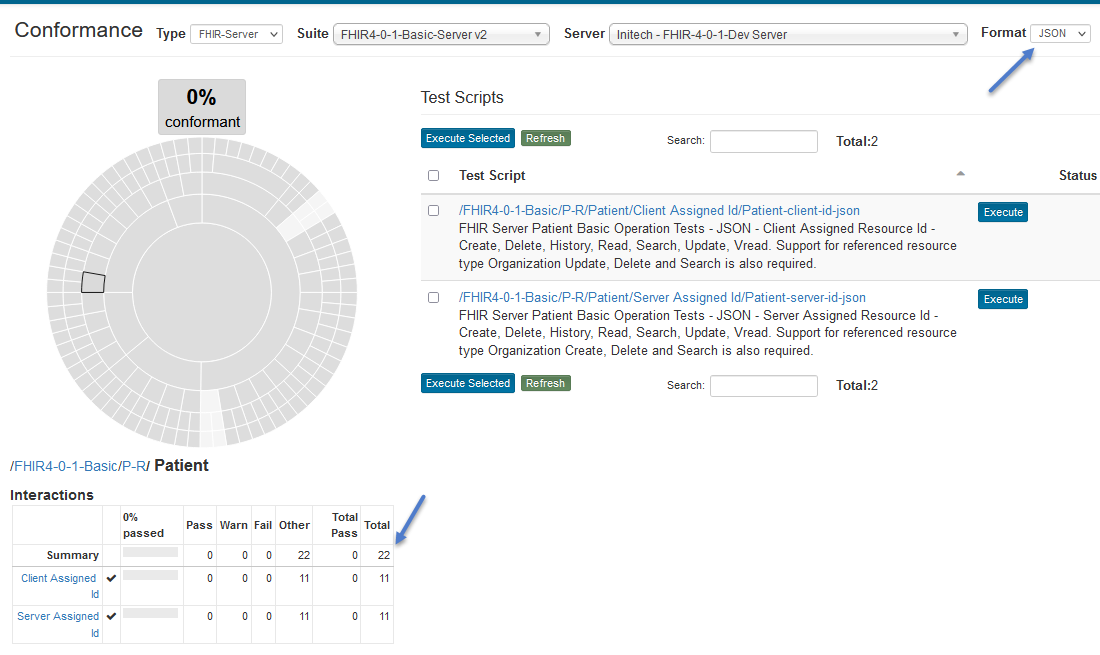
There are a total of 22 JSON Patient interactions (below arrow above) available in 2 test scripts in this suite.
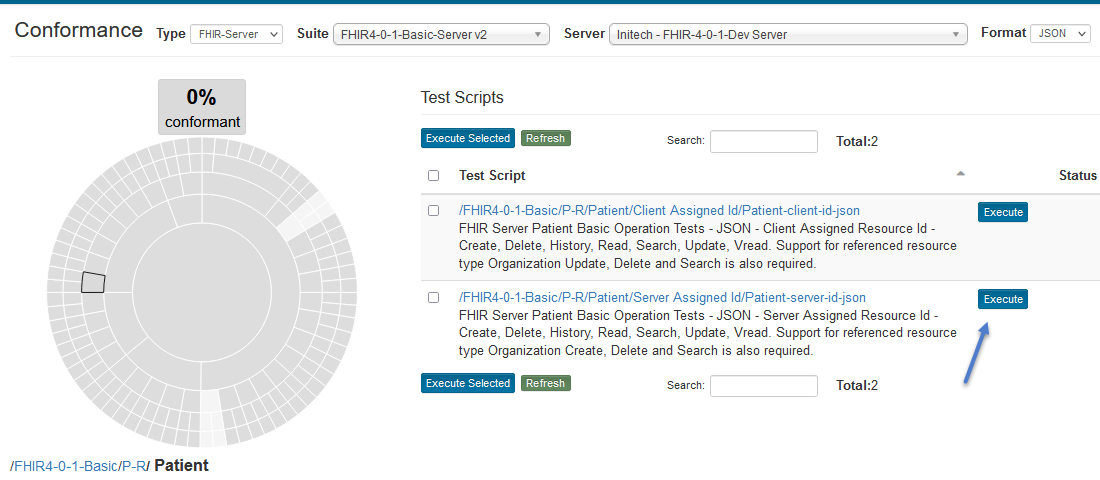
Click on the Execute button if you want to launch one test script:
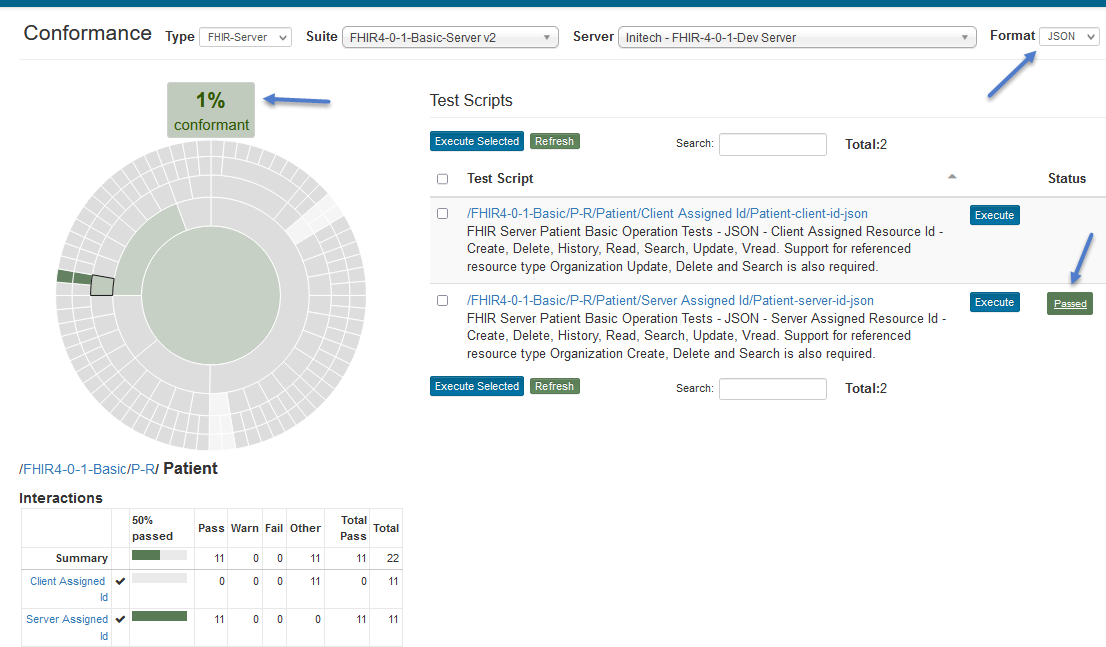
The test will get launched in the background. You might need to wait for a few seconds before refreshing the screen to see the status change to Running and then to either Pass or Fail:
Notice that the interaction counts in the summary tables have changed and so have the percentages. The overall “% conformant” is now at 1%.
Select the parent band in the Results Summary chart and a bunch of test scripts and click on Execute Selected:
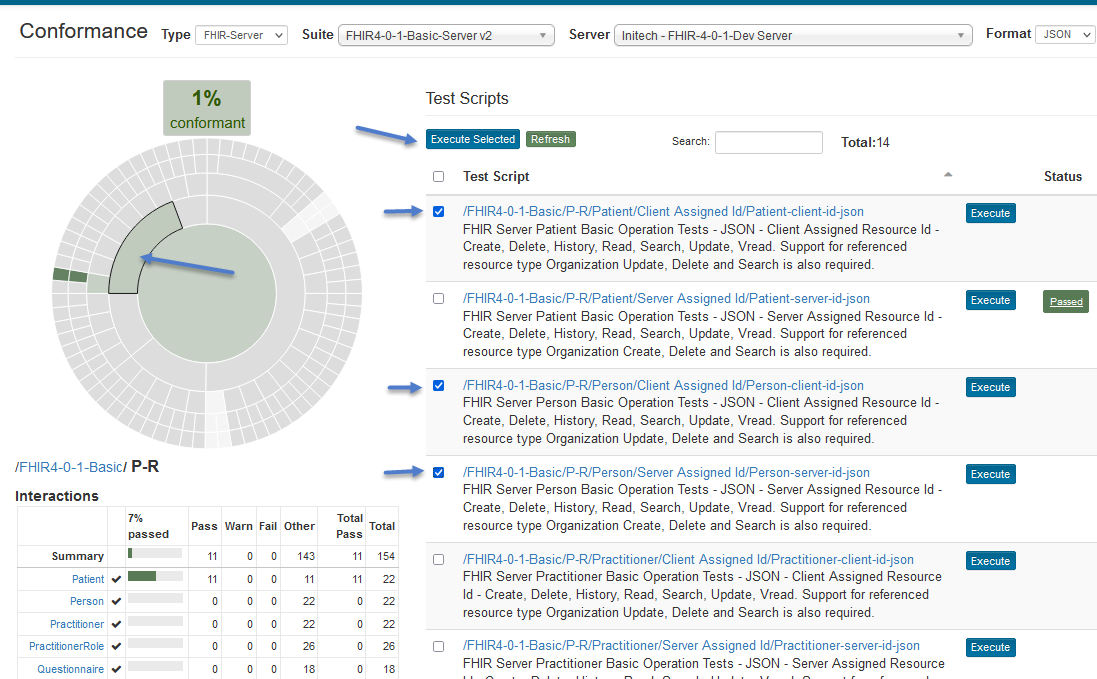
Notice that ‘% Conformance’ has gone up to 4%. The “% conformant” does take into account all the interactions that have not been executed yet. It’s at 4% because we have only executed 4 test scripts.