Results Summary
This Results Summary page gives you the Result Summaries (left chart on Current page) of different test systems for the selected Conformance Suite.
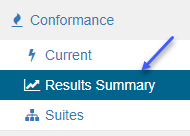
You can get to the Results Summary page by clicking on Conformance / Results Summary link on the left menu:
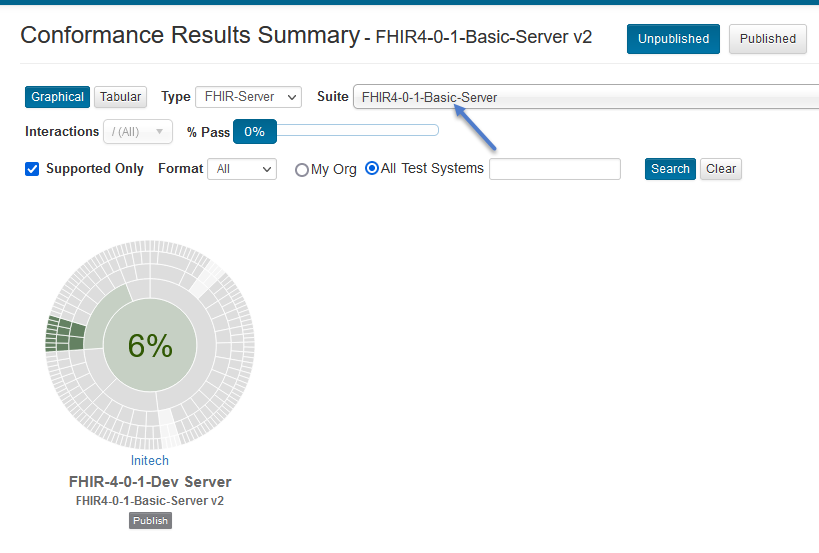
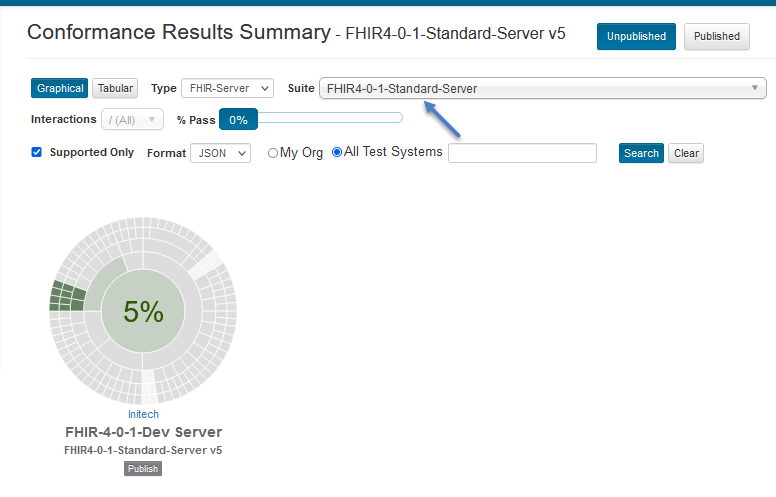
We see one result for FHIR4-0-1-Basic-Server Conformance suite and one for FHIR4-0-1-Standard-Server suite:
Execute some test scripts in FHIR4-0-1-Basic-Server Conformance suite on Current page against a different test system:
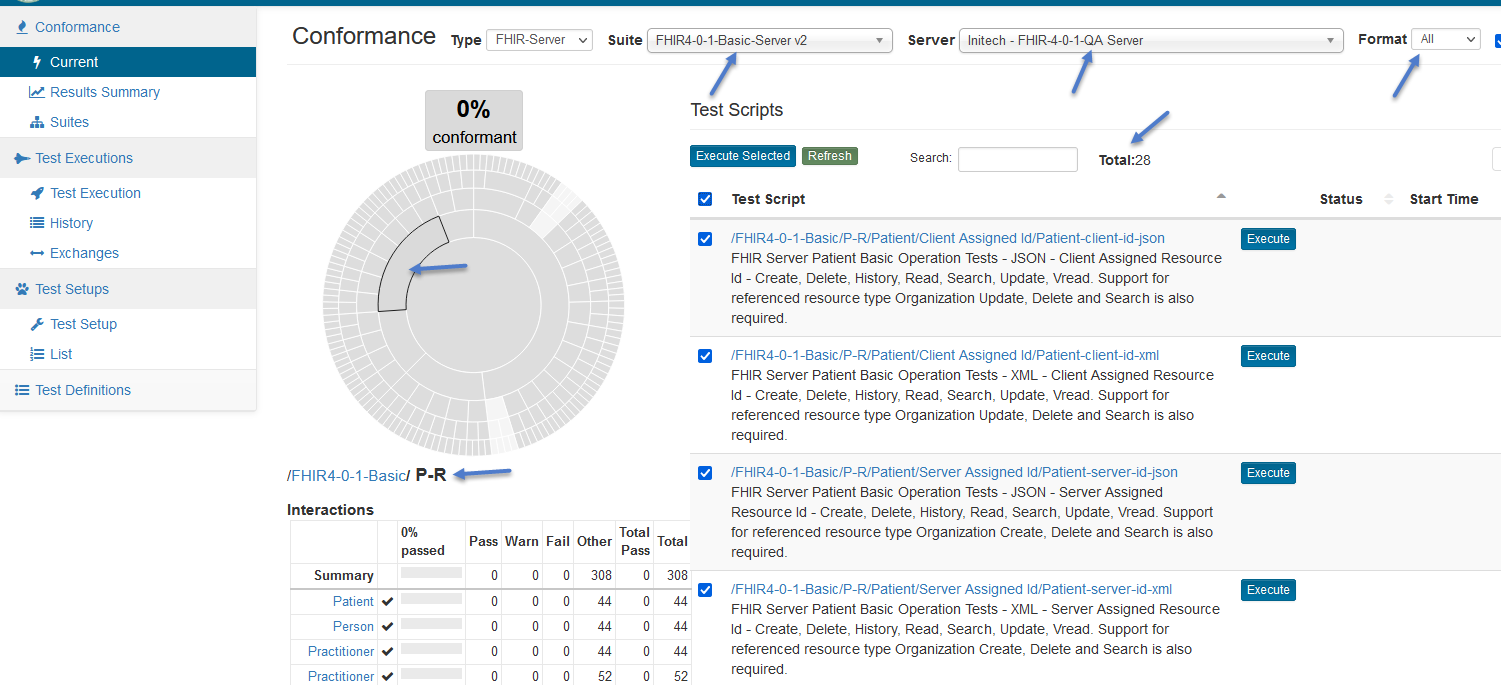
Notice that we’re executing both XML and JSON test scripts against the FHIR 4-0-1 QA Server test system.
Go back to the Results Summary page and select FHIR4-0-1-Basic-Server Conformance suite. Notice the extra test system in the results when JSON format is selected:
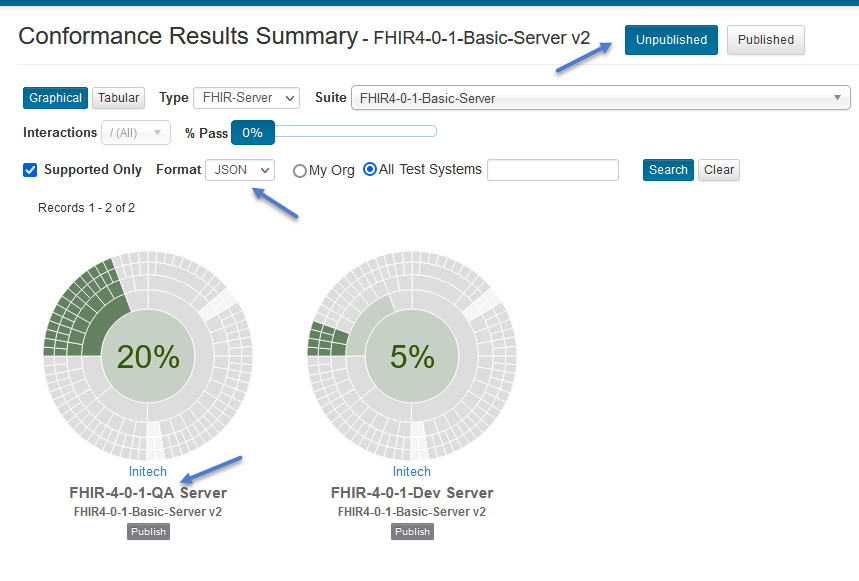
We had executed JSON test scripts against both test systems.
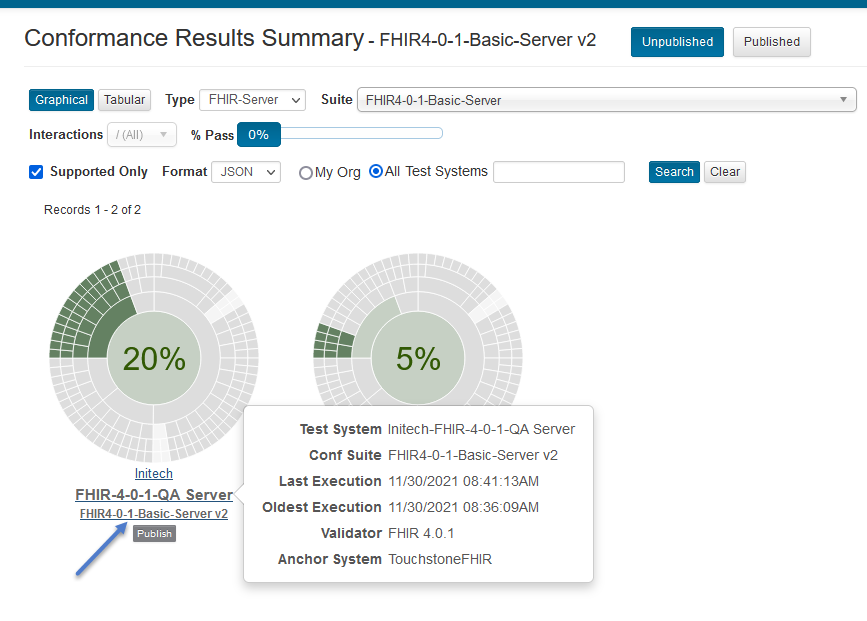
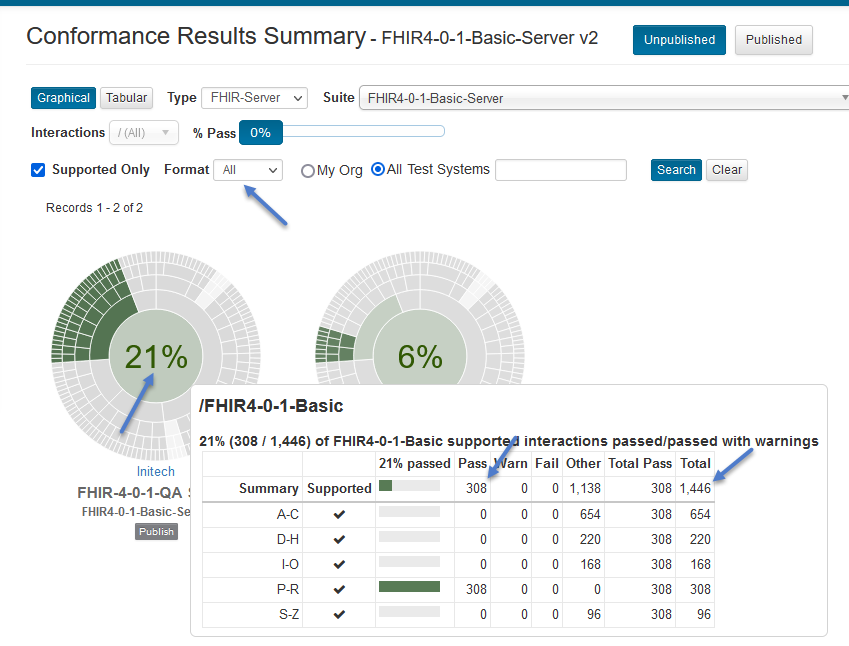
Hover over the text to get more information about the results:
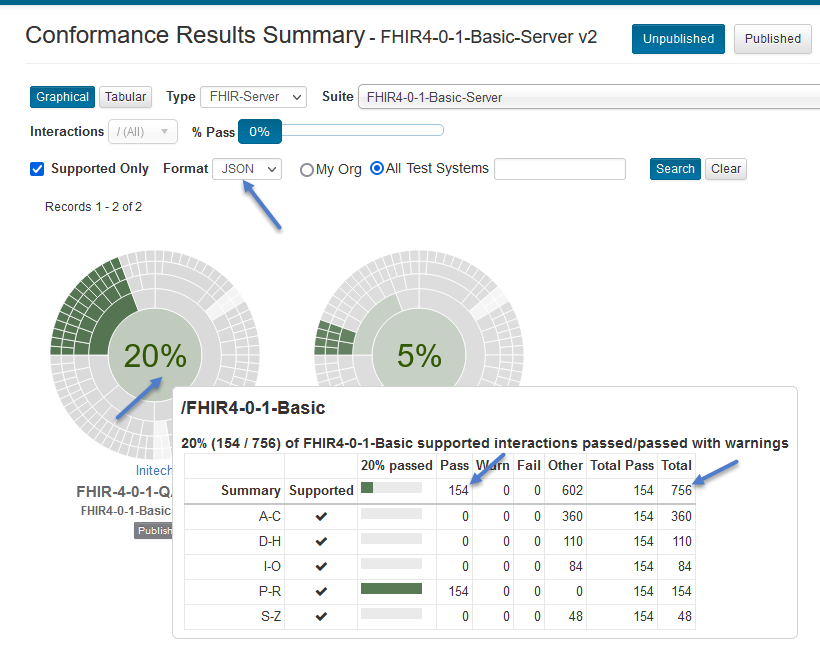
Hover over the central band to get the aggregated counts:
Changing the format selection to All will continue to show both test systems as All includes JSON and we executed JSON test scripts against both test systems:
However, the aggregated counts will be different when the format selection is All:
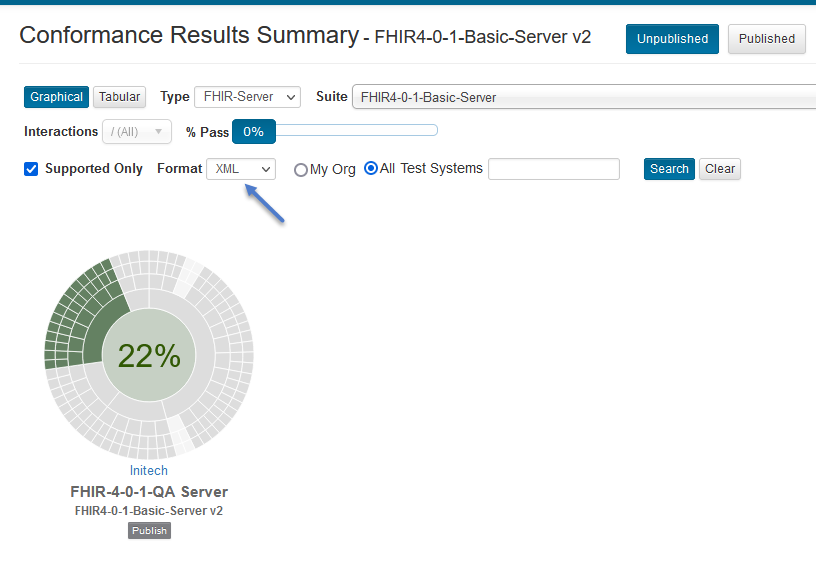
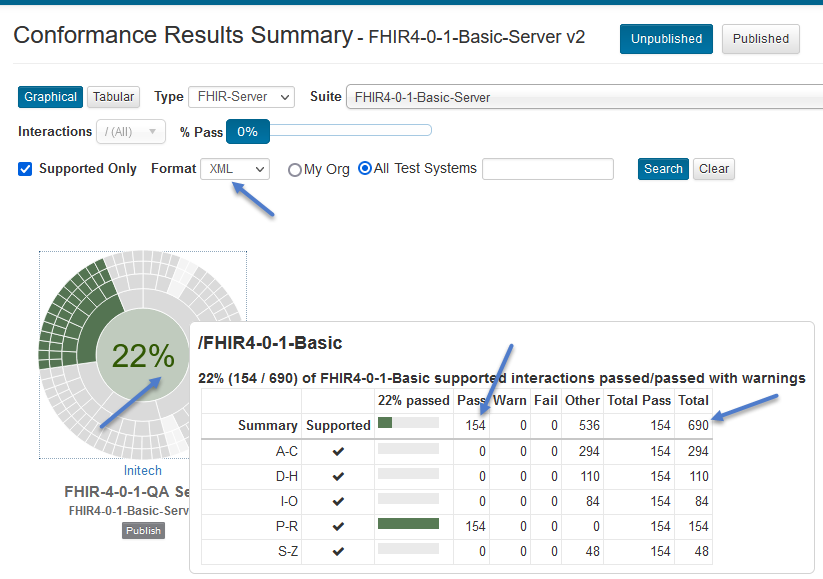
Change the format selection to XML. Notice that the listing includes only the server that has XML results:
Hover over the central band to get the aggregated counts:
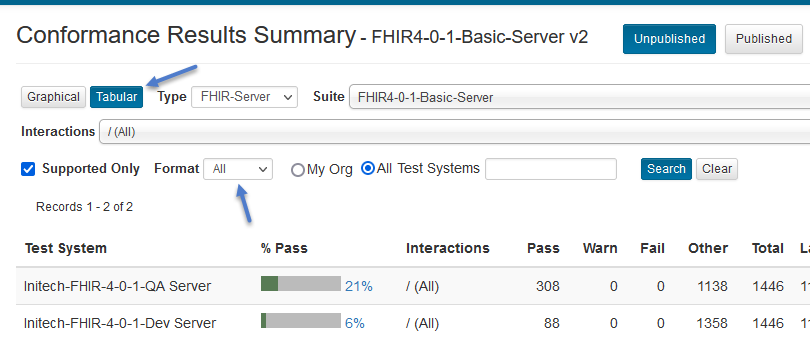
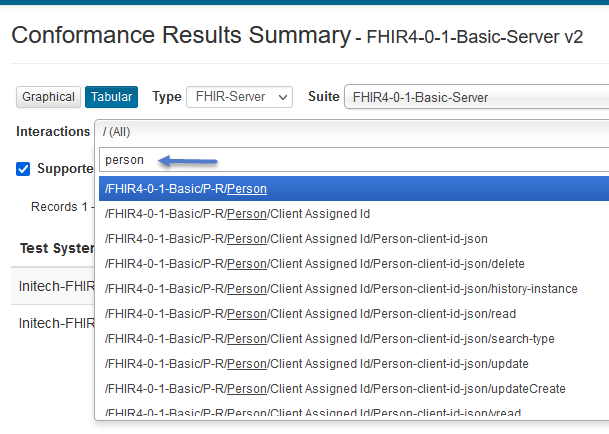
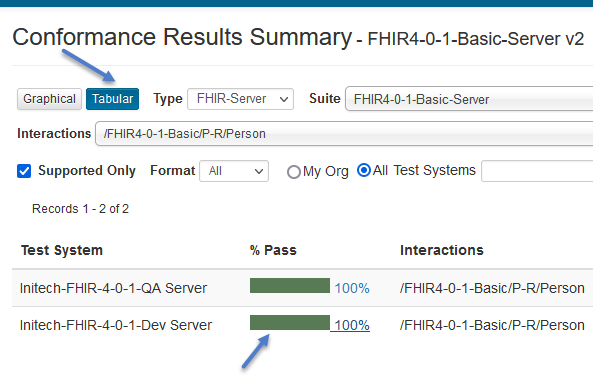
Change the view to Tabular:
Type ‘person’ in the Interactions select box to filter for Person resource interactions and select it:
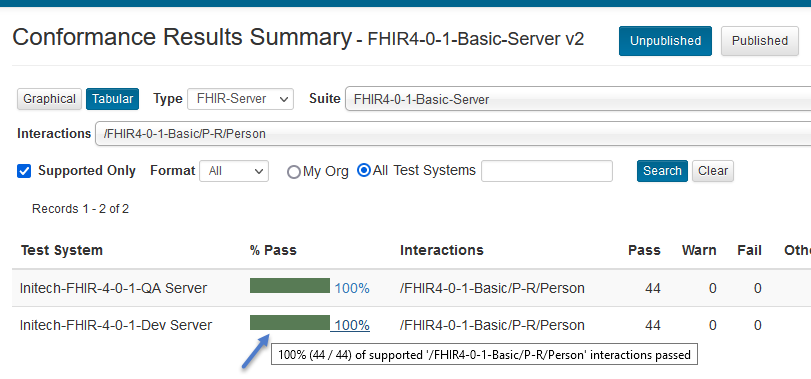
Notice that you can compare test systems at more granular levels. Hover over one of the progress bars:
Note
The Interactions filtering is available only on Tabular view and only when a specific Conformance Suite version is selected.
It becomes disabled when:
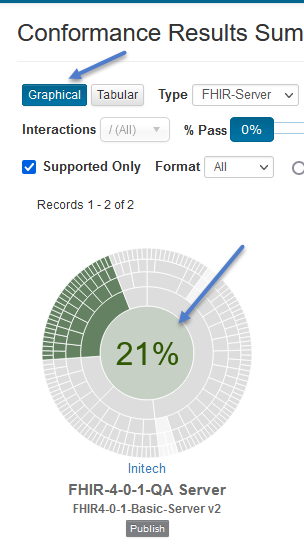
Graphical view is selected. This is because the summary charts in Graphical view already break down the interactions within the chart itself.
All is selected for Conformance Suite version. This is because different versions of a given Conformance Suite can have completely different test groups and test scripts.
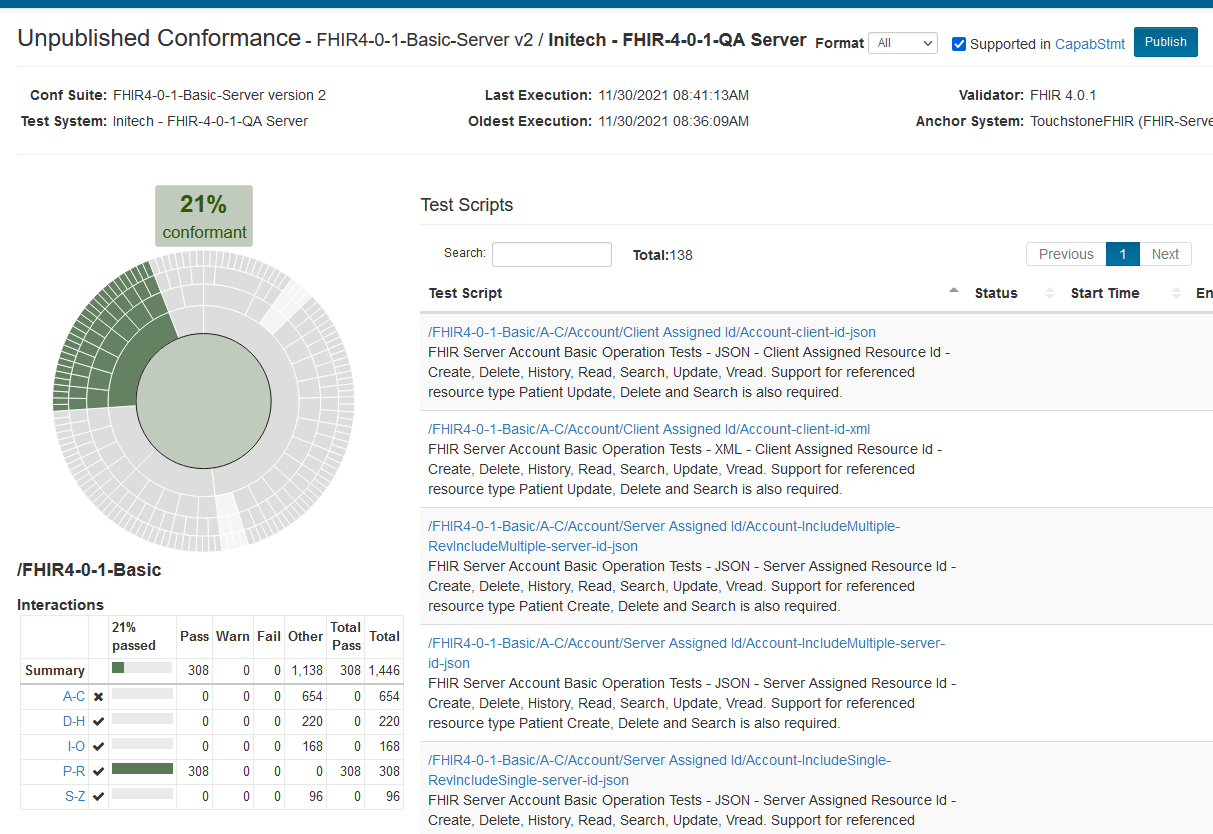
You can go to the Unpublished result details by:
Clicking on a progress bar in Tabular view:
Clicking on a chart in Graphical view:
Unpublished Conformance details page: