Multi Test Group
The Current (Conformance) page represents the latest Conformance metrics for the selected Conformance Suite and Test System.
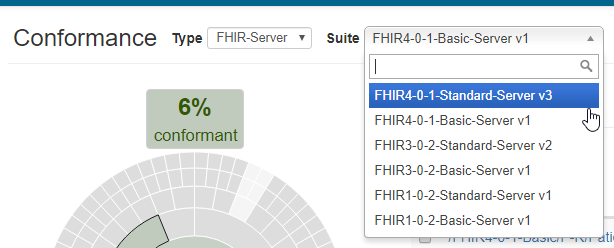
Change the Conformance Suite to one that’s composed of more than 1 test group:
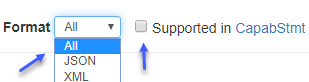
Also change the Format to All and Supported to unchecked :
Notice that even though, this is the first time you’ve used this Suite, the ‘% Conformance’ is already at 1%:
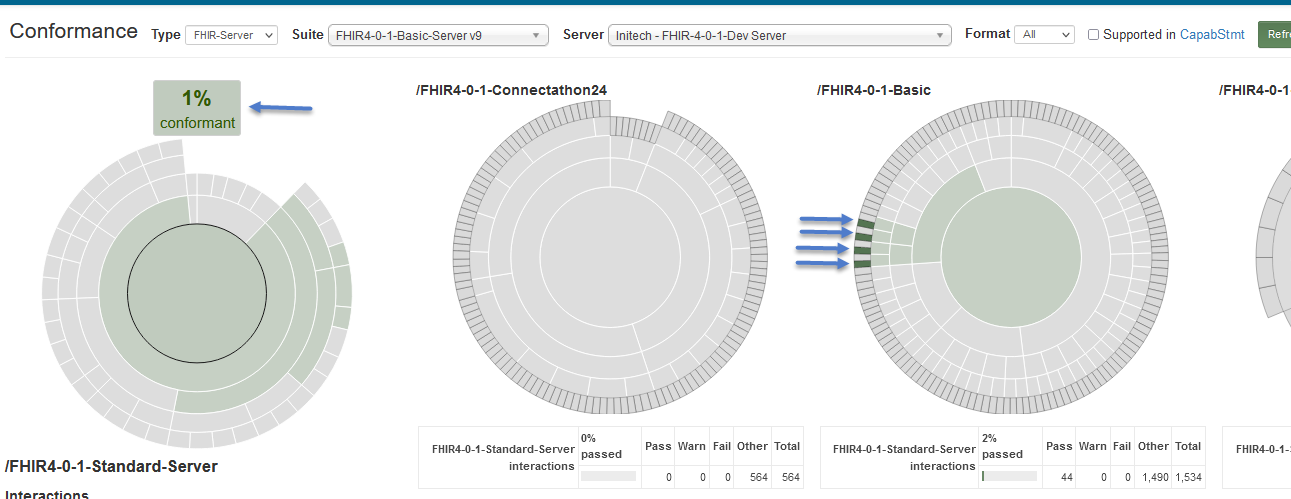
This is because the /FHIR4-0-1-Basic test group is also part of FHIR4-0-1-Basic-Server conformance suite and we had executed the 4 test scripts in green above earlier against the same test system. See this FAQ for more details.
The Conformance Suite contains 3 Test Groups (blue rectangle below).
The center-most band (red arrow) that’s selected by default is the root of the Categorization chart (red rectangle below). It’s FHIR 4.0.1-Standard-Server in this case. When a Conformance Suite has more than one Test Group, the interactions are grouped and summarized into the Categorization chart.
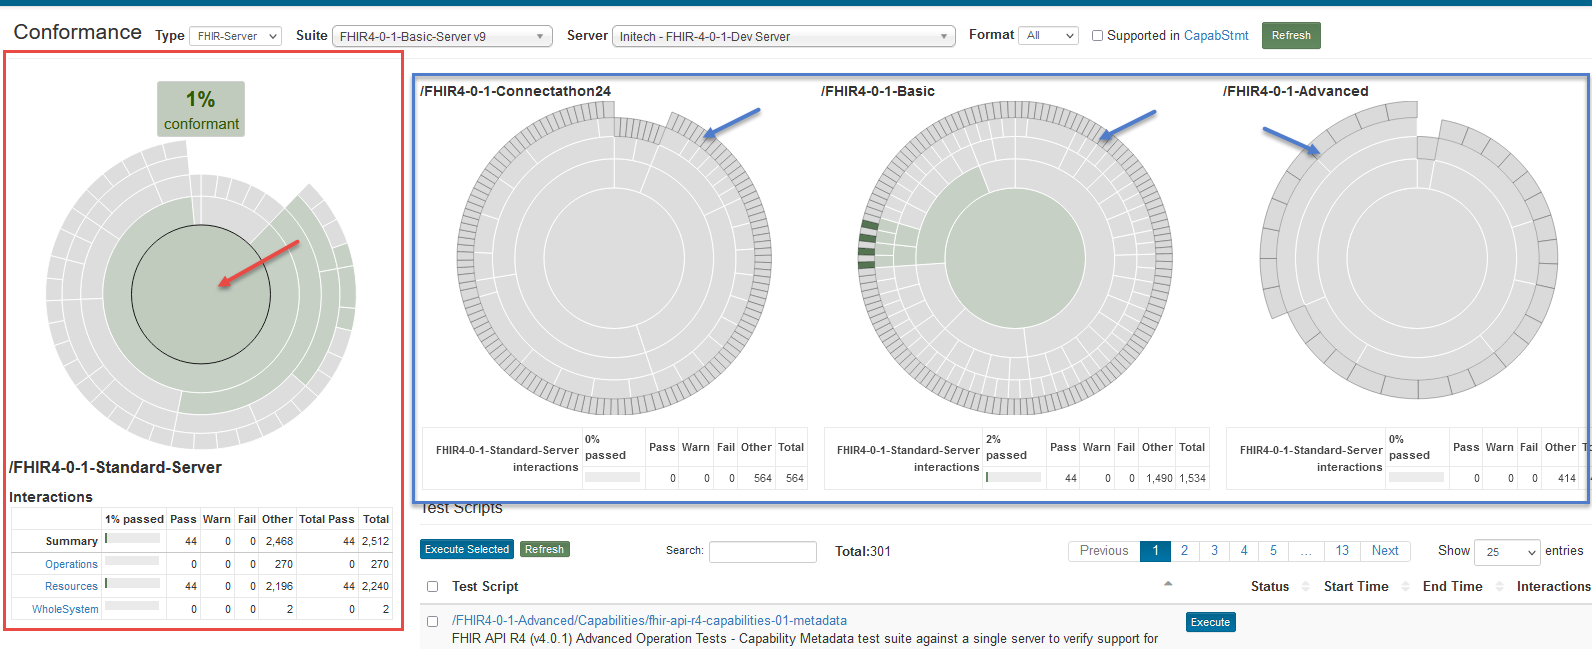
The charts on the right (blue rectangle) feed into the Categorization chart (red rectangle). The Categorization chart is driven by the categories in FHIR specification’s Resource List and is customizable by the suite owner. The current band has a black border circle (red arrow above). The outermost bands of charts on the right are individual test scripts in Touchstone. Those that contain interactions for the current band (FHIR 4.0.1 in this case) will get a dark-grey border. In this case, because we’re on the root band in the Categorization chart, all outermost bands on the right have a dark-grey border (blue arrow above).
The Test Scripts table below the charts will show all the test scripts for the currently selected band. Because we’ve selected the root band in the Categorization chart, all test scripts in FHIR 4.0.1-Standard-Server suite will be listed in this table.
Note
When a Conformance Suite contains multiple test groups, Categorization is mandatory for the suite, and the Categorization chart and the Results Summary chart are the same.
If you’d like to focus only on interactions that your capability statement supports, click on the Supported Only checkbox:
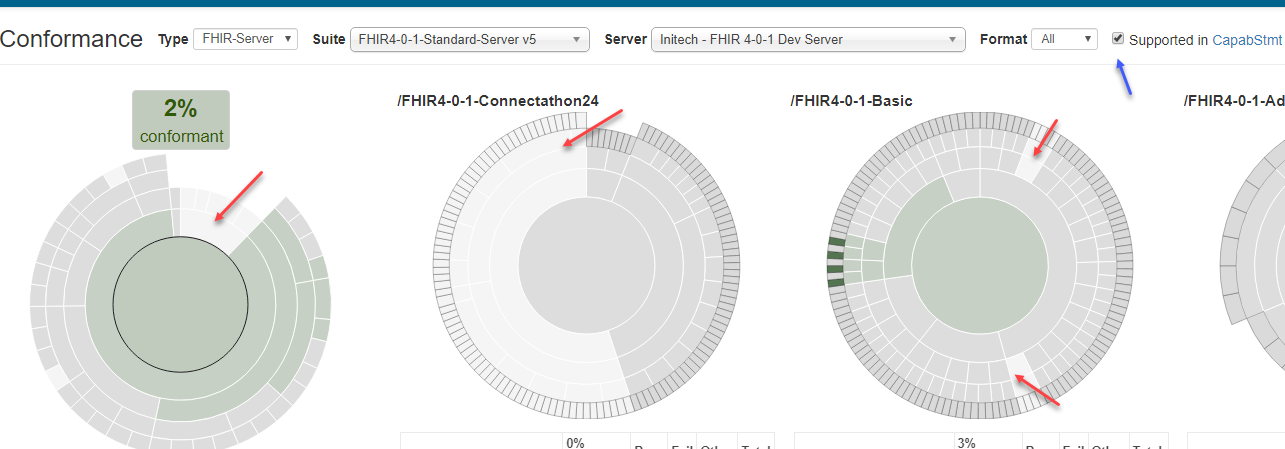
Notice that some bands have changed to silver (red arrows above). Those are the areas that are not supported by this test system. Only the interactions that are supported by the Capabilities statement are contributing towards ‘% Conformance’.
Note that the Supported checkbox may not be available for all Conformance Suites. The Suite owner can choose to make the checkbox unavailable for a suite in which case all interactions will contribute towards ‘% Conformance’ regardless of support in Capability Statement.
Suppose you’re interested in executing tests for the Patient resource. You can hover over the Results Summary chart to find the Patient resource (blue arrow below):
As you hover over each band, the test scripts that contain tests for that area are highlighted in dark grey on the right (black arrows below).
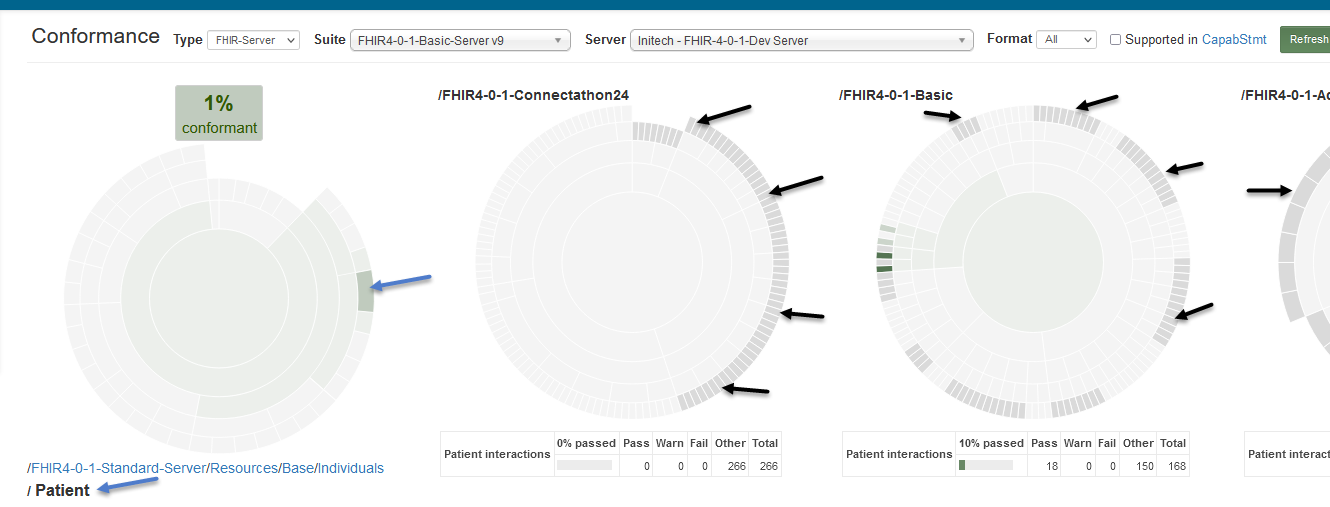
Click on the /FHIR4-0-1-Standard-Server/Resources/Base/Individuals/Patient band (below arrow below) on the Results Summary chart:
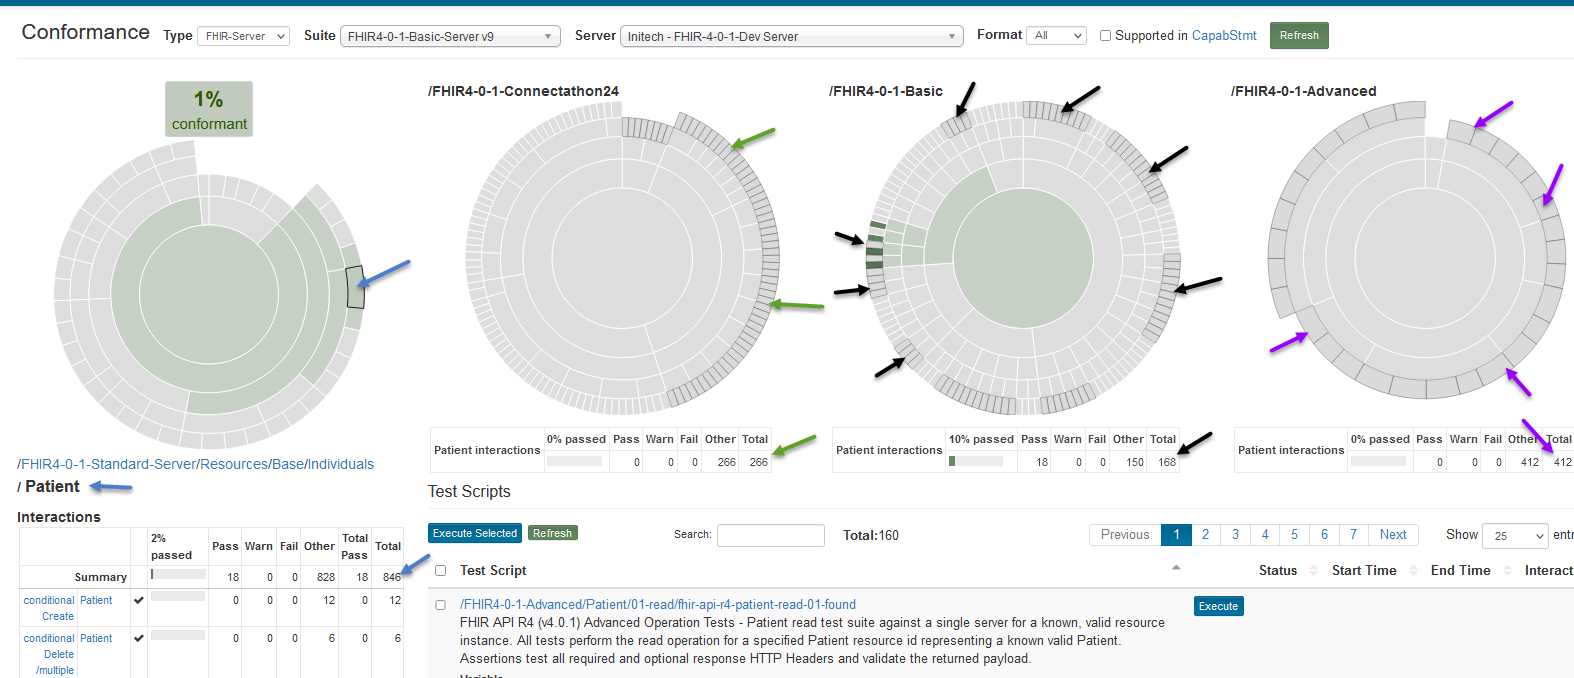
All the test scripts in charts on the right that have interactions for the Patient resource get a dark-grey border (green, black, and purple arrows). The counts of those interactions are displayed for the corresponding group underneath it.
There are a total of 846 Patient interactions available in 160 test scripts in all test groups in this suite. See blue arrows.
In Connectathon24 test group, there are a total of 266 Patient interactions. See green arrows.
In Basic test group, there are a total of 168 Patient interactions. See black arrows.
In Advanced test group, there are a total of 412 Patient interactions. See purple arrows.
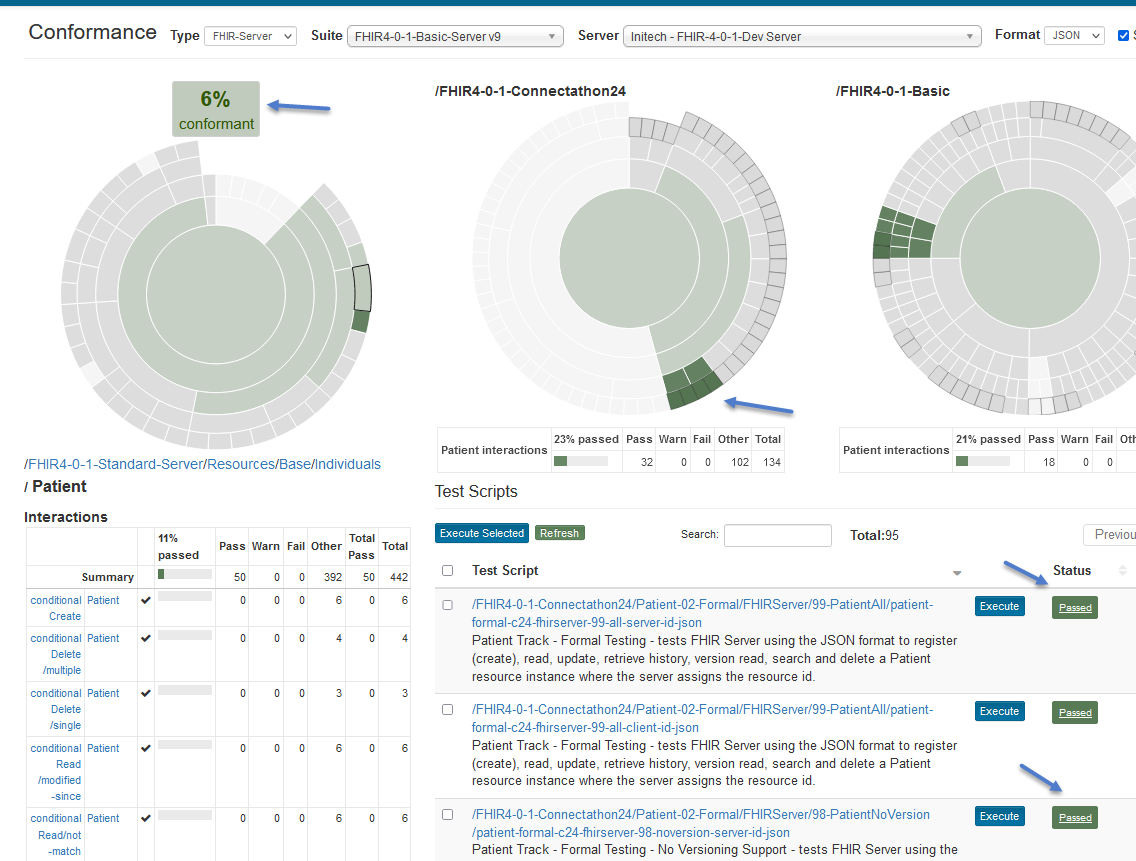
This particular suite offers filtering by formats (All, XML, JSON). Perhaps you’re interested in testing out the JSON format first. You can select JSON in the Formats dropdown (red arrow).
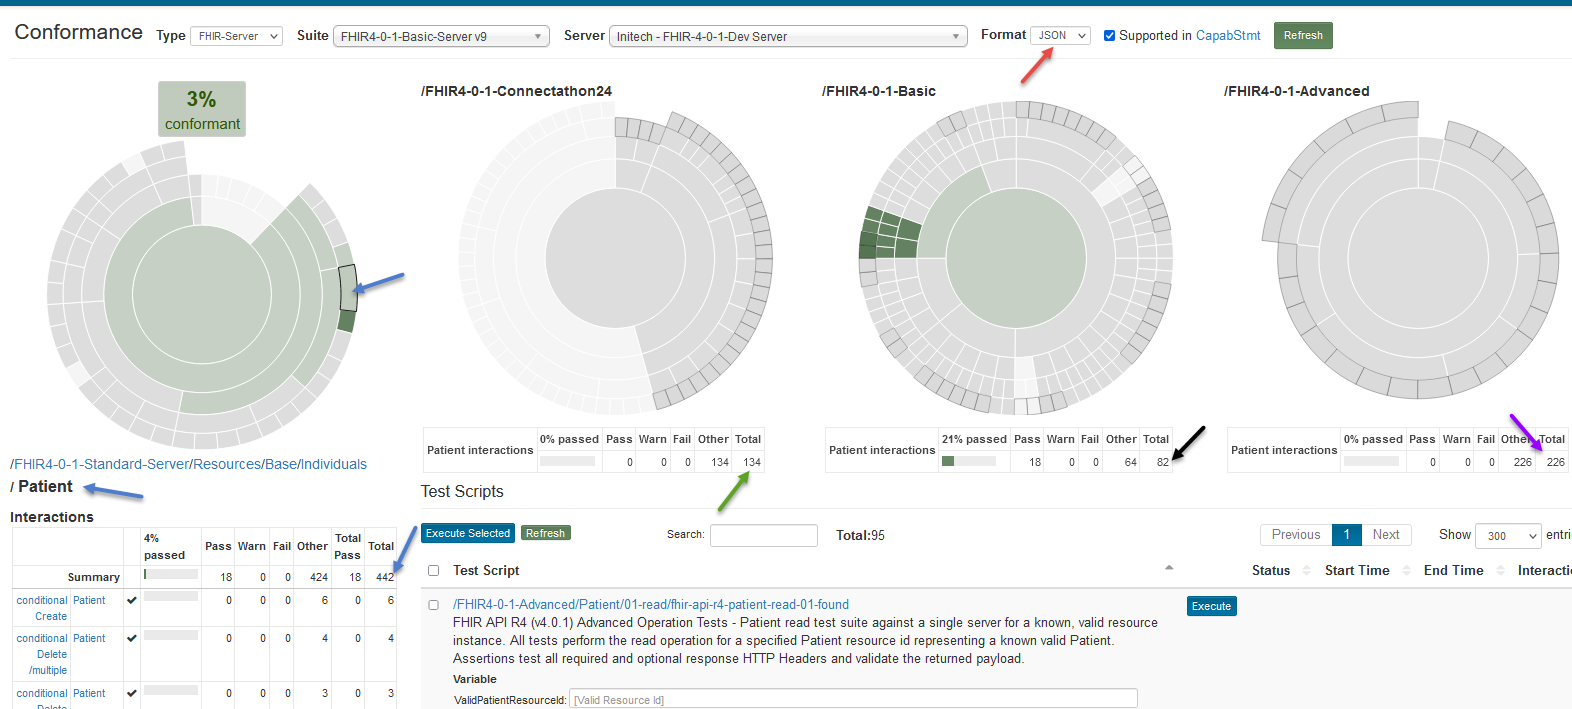
The test scripts and counts change to reflect the JSON interactions available in the suite.
There are a total of 442 JSON Patient interactions available in 95 test scripts in all test groups in this suite. See blue arrows.
In Connectathon14 test group, there are a total of 134 JSON Patient interactions. See green arrows.
In Basic test group, there are a total of 82 JSON Patient interactions. See black arrows.
In Advanced test group, there are a total of 226 JSON Patient interactions. See purple arrows.
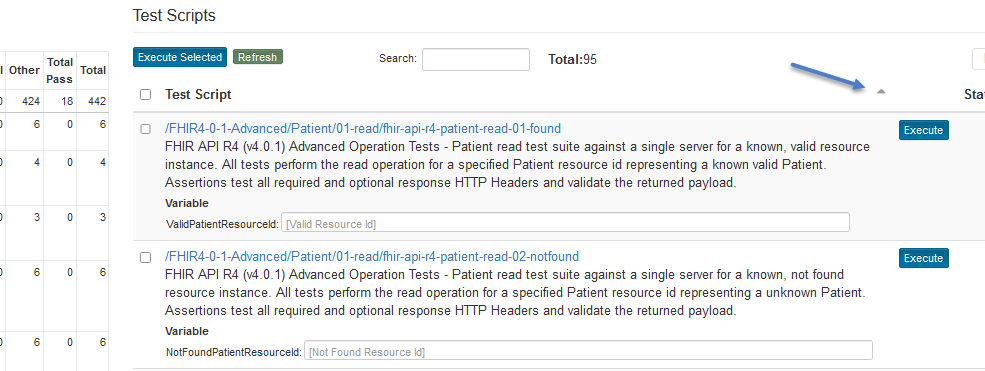
Flip the sort direction to Descending:
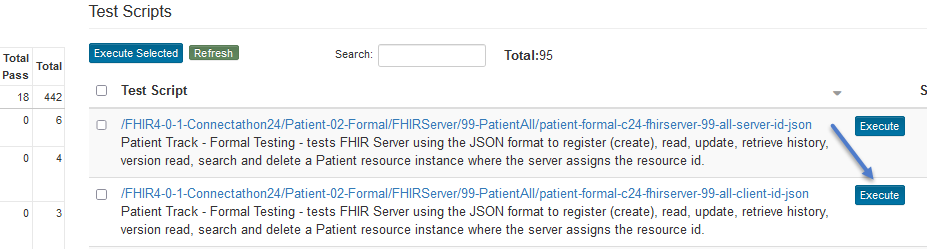
Click on the Execute button if you want to launch one test script:
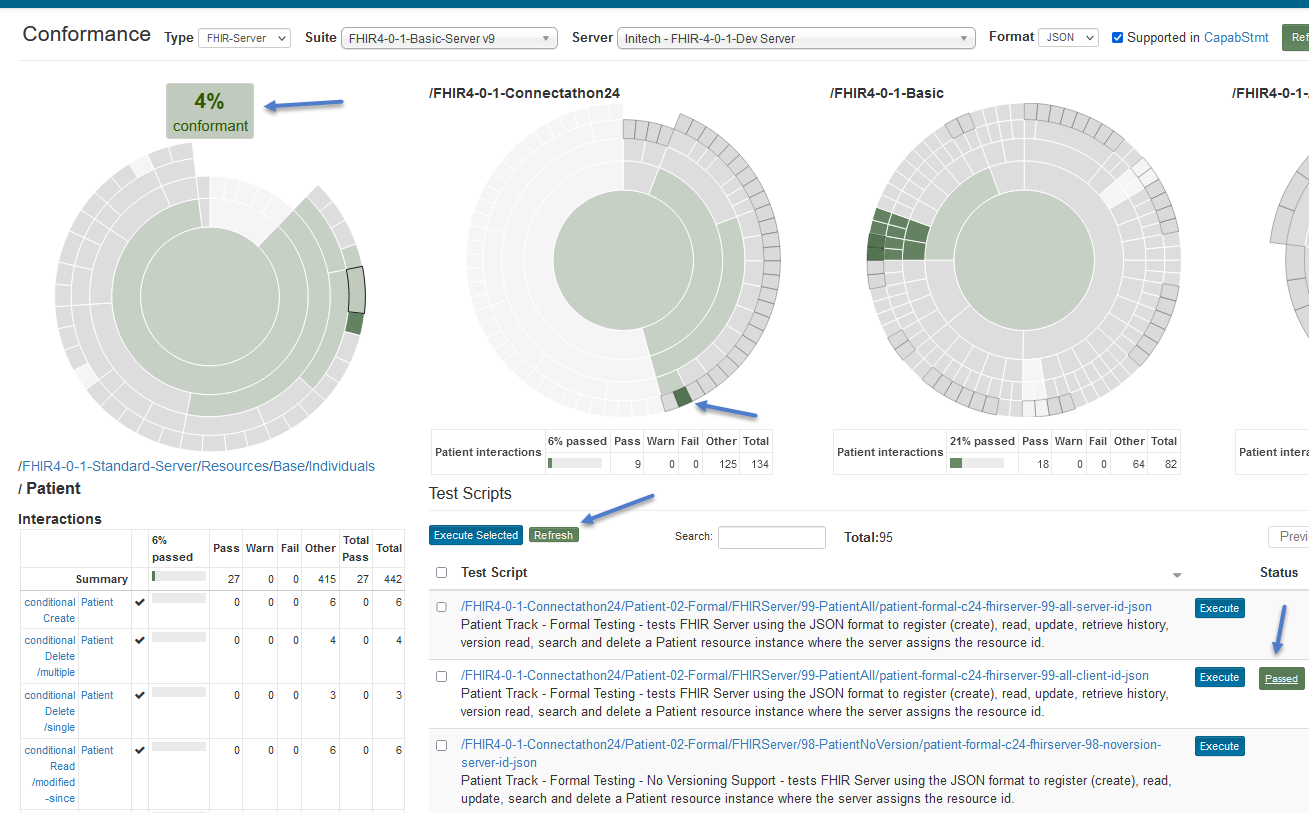
The test will get launched in the background. You might need to wait for a few seconds before refreshing the screen to see the status change to Running and then to either Pass or Fail:
Notice that the interaction counts in the summary tables have changed and so have the percentages. The overall “% conformant” is now at 4%.
Select a bunch of test scripts and click on Execute Selected:
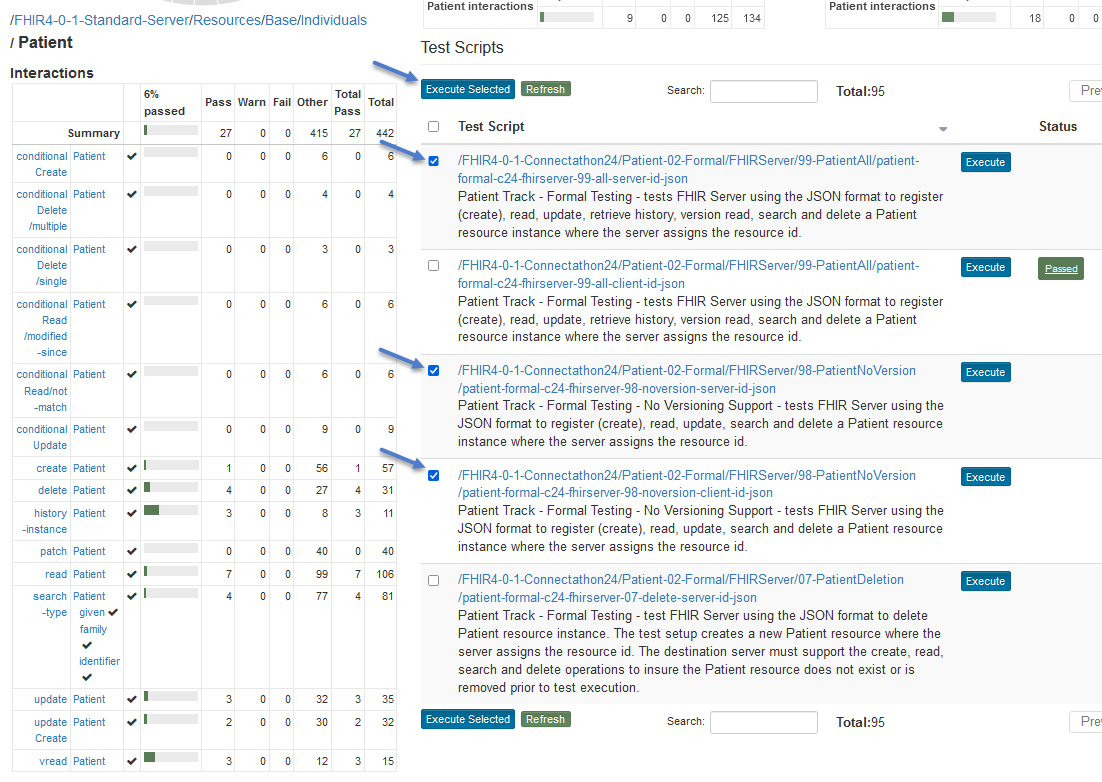
Notice that ‘% Conformance’ has gone up to 6%. The “% conformant” does take into account all the interactions that have not been executed yet. It’s at 6% because we have only executed a few test scripts.